Most HR leaders feel a creeping sense that their succession planning lacks direction and measurable outcomes.
Filling critical positions takes too long, and when filled, they are often occupied by unprepared individuals.
This leads to:
- Operational disruptions
- Instability
- Costly turnovers
Poorly managed CEO and C-suite transitions in the S&P 1500 result in an annual loss of nearly $1 trillion in market value.
Solution? Use succession planning metrics to effectively manage transitions for critical roles.
By seamlessly implementing and tracking succession planning metrics through our talent management platform Peoplebox, you can address these challenges head-on.
Read on to find out:
- What are succession planning metrics and why do you need them
- Top 10 succession planning metrics and how to calculate them
- How to use Peoplebox to track these metrics in your company to ensure a robust pipeline for critical roles
What Is Succession Planning?
Succession planning is the process of finding and training employees within the company to take on critical roles in the future.
A critical role is any key position essential to an organisation’s operations and success, where losing the current occupant would significantly impact the business.
As internal candidates are already familiar with the company culture and processes, succession planning helps:
- Shorten the time needed to fill critical positions
- Ensures smoother transitions and continuity
- Preserve institutional knowledge
- Shorten the learning curve
- Reduce hiring costs
Overall, it helps maintain organisational stability and growth, while also promoting career development within the company, boosting employee morale and loyalty.
But to manage your succession planning program effectively, you must track some key metrics.
What Are Succession Planning Metrics?
Succession planning metrics tell you how your succession planning efforts are going, and identify areas to improve.
These metrics can be qualitative or quantitative.
Qualitative Metrics
Qualitative metrics include things like:
- Leadership potential
- Talent development
- Succession readiness
These inherently subjective metrics are often based on assessments, managers’ opinions, 360-degree performance reviews, and employees’ self-evaluations.
Quantitative Metrics
On the other hand, quantitative metrics include data that can be tracked and measured over time. Such as:
- % of critical positions filled internally
- Time taken to fill critical roles
- Diversity in leadership positions
You usually need a mix of qualitative and quantitative metrics for a full understanding of your leadership pipeline.
Let’s look at some of them now.
Top 10 Succession Planning Metrics
These 10 metrics help you plan for the future by identifying and developing employees to fill key leadership roles.
1. Potential
Potential refers to the likelihood that an employee can grow into a critical role within the organisation. The high potential (HiPo) employees are motivated and have the ability to succeed in senior positions.
Identifying potential successors is a must for effective succession planning. It ensures a pipeline of capable leaders ready to step into important roles.
How to measure potential:
Step 1: Start by collecting information on the skills needed for the critical role.
Step 2: Collect data on the employee’s performance via 360-degree feedback, performance reviews, OKR score, etc.
Step 3: Collect subjective feedback from peers and managers on the employee’s potential to grow into the role.
Step 4: To make sense of the data collected in the above steps, you can use a scoring system based on leadership skills, adaptability, and overall performance.
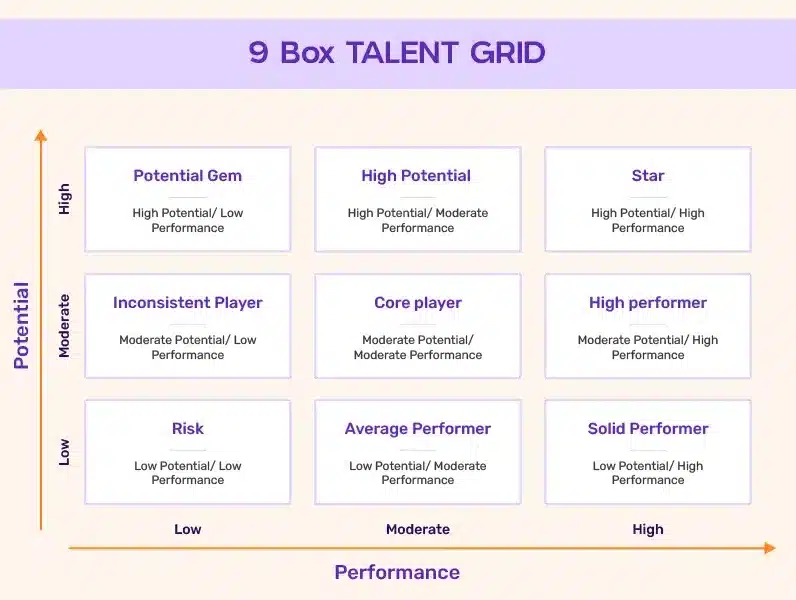
You can also plot the data on a 9-box grid to see where the employee is in terms of potential and performance.
2. Succession Readiness
Now that you have identified potential successors, success readiness measures how ready they are to step into key leadership roles.
It checks if these employees have the right skills, experience, and qualifications to step into these positions when needed.
Readiness could be categorised into 3 timelines:
- Ready now
- Ready in less than 1 year
- Ready in more than 1 year
Employees who are ready to take over important jobs right away help the company avoid disruption when key leaders leave or retire.
How to measure succession readiness:
You can measure the succession readiness of each potential employee subjectively in the following ways:
- Evaluate employee skills and performance, such as if the employee consistently produces good results while doing parts of a higher-level job.
- Ask managers if the person is ready for a new role.
- Evaluate based on how long it usually takes employees with similar potential and skill levels to get ready for critical roles.
- Regularly update and monitor their development plans.
3. Bench Strength
While succession readiness focuses on individual employees, bench strength looks at how prepared your company is as a whole to fill key leadership positions. It shows how many internal employees are prepared to step into key positions when needed.
The higher your bench strength, the better your succession planning is working.
How to calculate bench strength:
Bench strength is calculated as the average number of successors per critical role.
Step 1: Count the number of internal candidates who are ready or nearly ready to step into each critical role.
Step 2: Remember that one person might be ready for multiple roles. Counting each employee only once, divide the sum of ready successors by the total number of critical positions.
Bench Strength = Number of Ready Successors/Total Number of Critical Positions
The higher this number, the better. It is recommended to have at least 3 ready candidates for all your critical positions.
4. Risk of Loss of HiPo Employees
Risk of loss, also called “flight risk,” measures how likely it is that a high potential employee will leave the company in the next 3, 6, or 12 months.
By anticipating who might leave, companies can try to retain these valuable employees and ensure continuity for leadership roles.
How to measure the risk of loss:
Risk of loss is qualitatively assessed based on the following factors:
1. Job satisfaction
Check with the high-potential employees and their managers to see how happy they are with their job.
2. Engagement levels
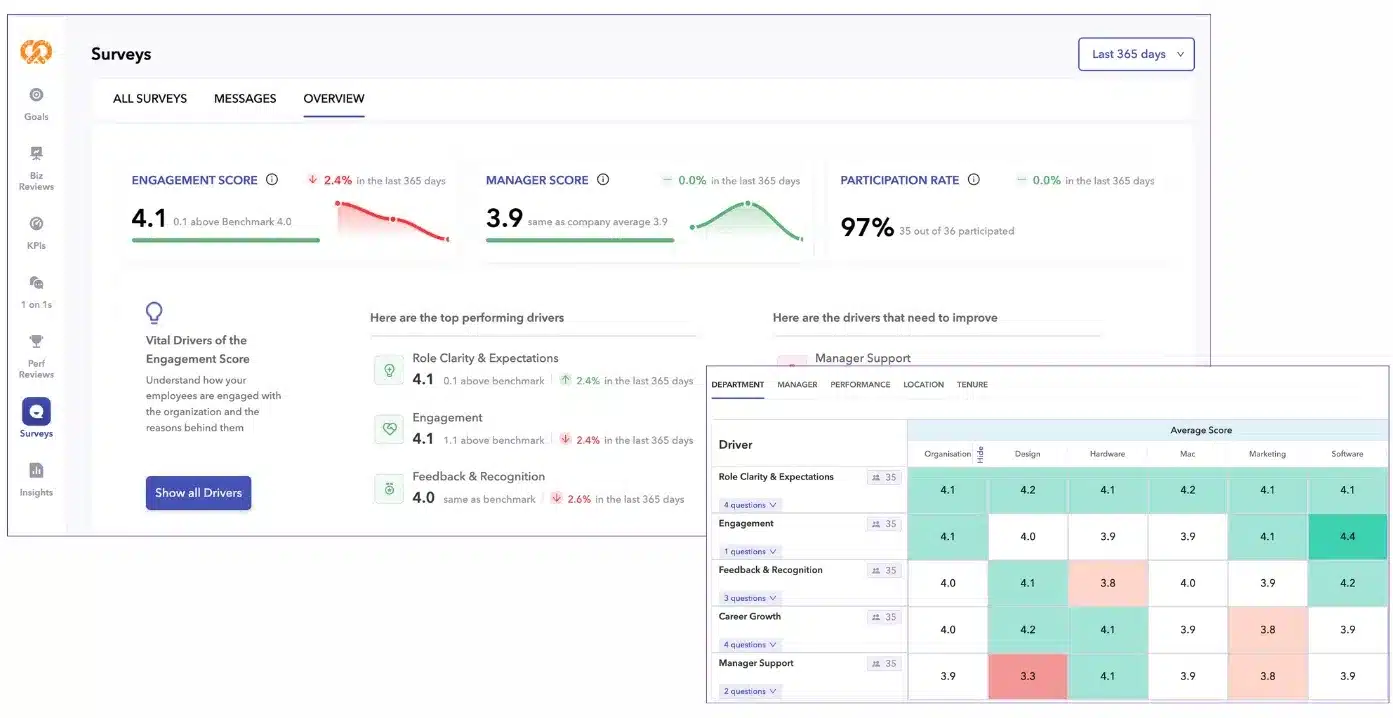
Check how involved and committed the employees feel. You can use the people analytics platform Peoplebox to measure and check employee engagement.
3. Performance
Gradual decline in performance or productivity of an initially high-performing employee might indicate flight risk.
4. Compensation
Make sure employees are happy with their pay. Questions such as these could help:
- Did they have minimal pay increases?
- Are they paid competitively with respect to the market?
5. Workplace culture
Besides looking at individual high-potential employees, the overall working environment in the company can show signs of whether employees might leave.
Do you provide a good working environment with qualities such as:
- Work-life balance: Ensuring employees have time for both work and personal life.
- Management quality: Having supportive and effective managers.
- Job security: Making employees feel secure in their jobs.
- Flexibility at work: Allowing flexible work hours or remote work options.
- Employee feedback and recognition: Regularly giving feedback and recognising employees’ hard work.
5. High-Potential Turnover
When the risk of losing high-potential employees isn’t managed well, it leads to turnover. High-potential turnover measures how often employees who are important for future leadership roles leave the company.
If you have a high potential turnover, it means your succession planning efforts are failing.
How to measure high-potential turnover:
Turnover Rate = (High-potential employees who left the company / Average high-potential employees in the company× 100
For example,
- High-potential employees who left the company: 7
- High-potential employees at the beginning of the period: 55
- High-potential employees at the end of the period: 50, assuming 2 HiPo employees joined the company since then
Calculate the average number of high-potential employees:
Average high-potential employees = (Number at the start + Number at the end) / 2
Average high-potential employees = (55+50)/2=52.5
So,
Turnover Rate=(7/52.5)×100
Turnover Rate=13.3%
To know if you have a high or low high-potential turnover rate, compare it to the turnover rate of all employees in your company. You can also compare it to the high-potential turnover rates in your industry.
To keep turnover low, conduct exit interviews to understand why HiPos are leaving and fix any common problems.
6. Talent Development
Talent development is key for getting high-potential employees ready for succession.
How to measure talent development:
Talent development is measured both qualitatively and quantitatively in the following ways:
- Percentage of identified potential successors who have formal leadership development plans in place.
- Quality and comprehensiveness of individual development plans created and followed.
- Percentage of employees completing designated training programs.
- Pre- and post-training assessment scores to measure skill improvement.
- Changes in performance ratings for employees participating in development activities.
- Qualitative feedback from employees on the effectiveness and relevance of training programs.
- Feedback from mentors on the progress and development of mentees.
7. Career Path Ratio
A career path ratio measures how employees grow in a company. It looks at how often they get promoted (move up) vs get transferred (move sideways).
It shows if you are doing a good job in helping employees grow.
How to measure career path ratio:
Record all job changes in a people analytics platform. Note if changes are promotions (upward) or transfers (sideways).
The formula for individual career path ratio:
Career path ratio = Number of promotions / Total number of promotions and transfers
The formula can be applied to an individual employee’s career path, or the whole company for any time duration.
For example, if 6 people were promoted out of 20 total changes, the ratio is 0.3.
High ratios (above 0.7) show frequent promotions.
Low ratios (below 0.2) might mean employees are stuck and not moving up. Lateral moves help employees grow with new roles, but too many can mean there’s no chance for promotion. Low rations may mean that you are hiring externally instead of promoting from within.
A career path ratio of 0.5 is considered good.
8. % of Critical Positions Filled Internally
This metric measures the percentage of important job roles filled by people already working in the company instead of hiring from outside.
It shows how well you are developing your own employees to step into important roles.
How to calculate it:
% of critical positions filled internally =
(Number of critical positions filled internally / Total number of critical positions filled) * 100
For example, if 7 out of 10 critical positions were filled by internal candidates, the calculation would be: 7/10 * 100 = 70%
While there is no exact target, a higher percentage of critical positions filled internally is usually better. Even a small increase can be a success if you are starting from zero.
If you find that most critical roles are being filled externally, you might need to improve your internal training and development programs.
9. Diversity Metrics
Diversity metrics measure how different groups of people, like gender, race, ethnicity, age, and disability, are represented among the successors for critical roles in a company.
The higher your % diversity, the better your succession planning program.
Diversity metrics are important because:
- Performance: Companies with diverse employees in management often perform better financially.
- Inclusivity: They help make sure that every qualified employee has a fair chance at leadership roles.
- Employee satisfaction: People are more likely to work at and stay with companies that value diversity.
How to measure diversity:
Step 1: Use your company’s definition of diversity.
Step 2: Count the number of HiPo employees from diverse groups and divide by the total number of high-potential employees.
Example: If there are 25 employees from diverse groups out of 100 potential successors,
% Diversity = (25/100)*100 = 25%
Compare the diversity of current employees in critical roles with the diversity of potential successors.
Example: If 5% of current key role employees are diverse, but 15% of successors are diverse, this means your succession plan is helping to increase diversity in management and leadership positions.
To increase diversity, implement merit-based promotions and use standard tests to measure candidates’ skills and abilities objectively.
10. Time-to-Fill Critical Roles
Time-to-fill measures how quickly a vacant critical role is filled. The quicker you fill the job, the more effective your succession planning efforts are.
How to calculate time-to-fill:
Count the number of working days from when the job opens to when someone accepts the job offer.
Implement and Track Succession Planning Metrics with Peoplebox
Now that you have a fair idea of the top 10 succession planning metrics, check out Peoplebox to track and manage your succession planning efforts:
- Identify key roles: Use the org chart to pinpoint critical positions.
- Evaluate performance: Conduct performance reviews directly in Slack/Teams to assess employee potential.
- Monitor progress: Utilise dashboards for real-time insights and track metrics.
- Engagement surveys: Measure employee engagement and identify areas for improvement.
Ready to build a thriving workforce? Get in touch today.