It’s crunch time. David, the CEO, needs a quick picture of employee performance before a crucial investor meeting. Sarah, the HR director, scrambles to pull together reports from multiple systems – headcount by department from the HRIS, performance review data for the year, recent survey results from a third-party tool, and even paper exit interview notes. By the time she cobbles together a presentation, the data is outdated, and valuable insights are lost in the shuffle.
This data fragmentation is a common challenge in HR. According to a Forrester study, data silos cause employees to lose 12 hours a week chasing down information. For HR teams, this translates to wasted time, missed opportunities, and ultimately, a disconnect between people strategy and business goals.
The solution? A unified HR dashboard. In this blog post, we tell you everything you need to know about HR dashboards. Dive in!

What is an HR Dashboard?
An HR dashboard is essentially a digital control panel for your workforce. It brings together key HR metrics and data points from various systems into a single, easy-to-understand interface. Instead of sifting through endless reports, this dashboard allows you to track and analyze critical HR information in real-time.
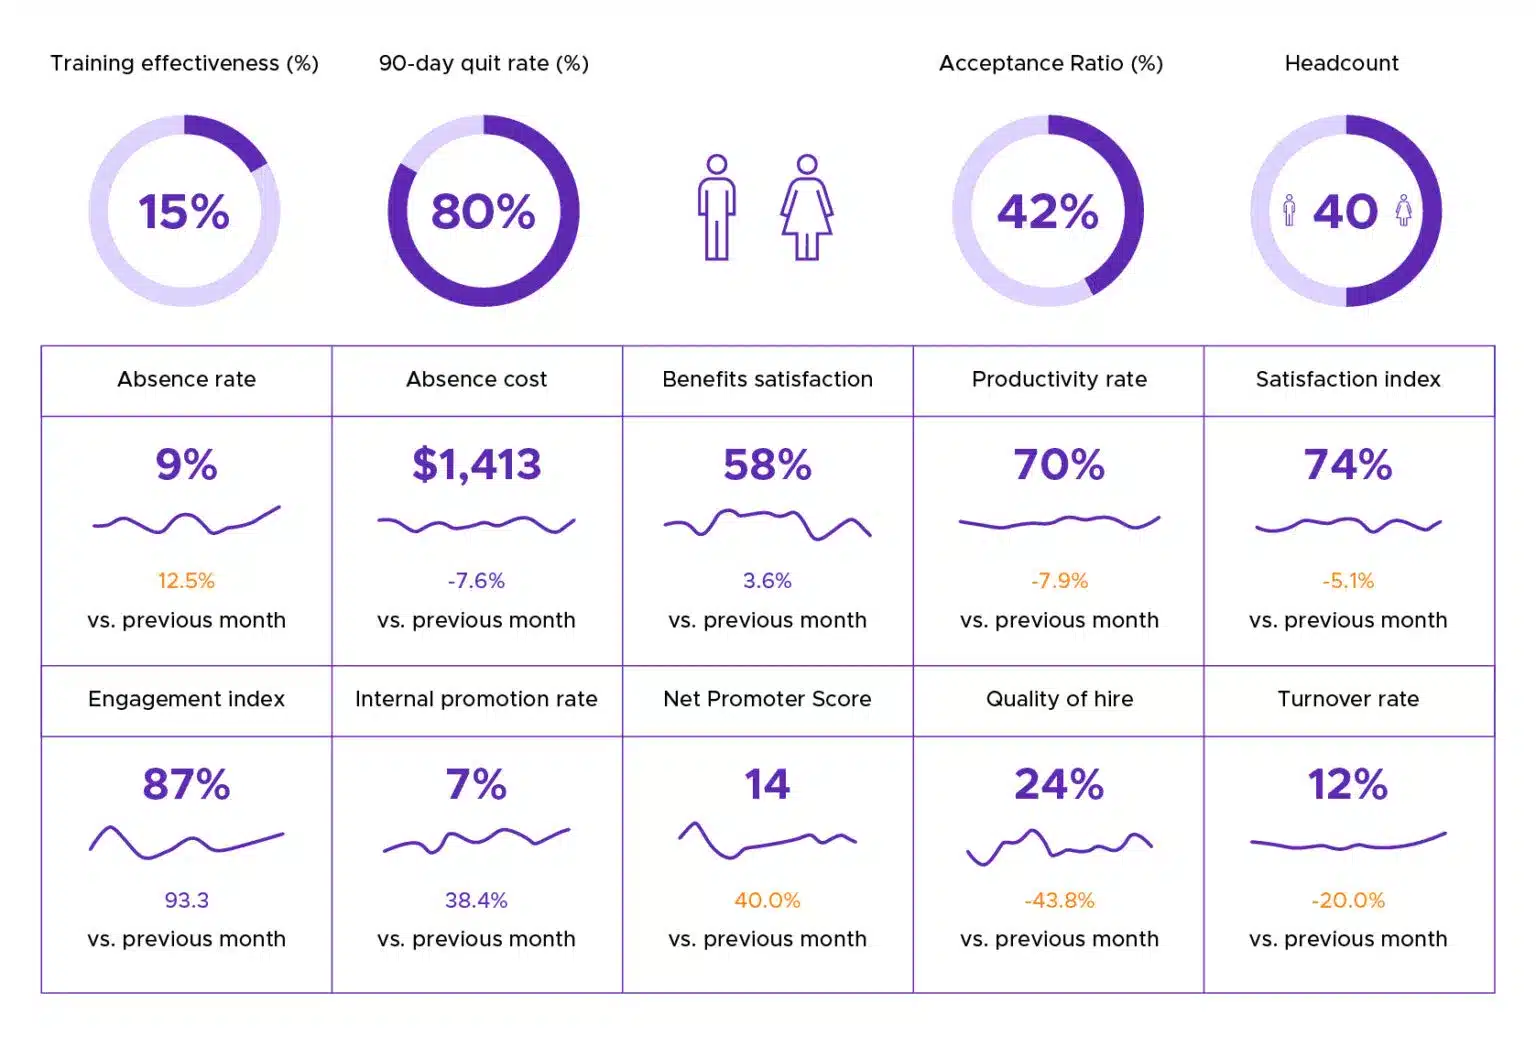
This empowers HR professionals to make informed decisions about:
Recruitment trends: How long does it take to fill open positions? Are you attracting the right candidates?
Employee performance: How are your teams doing? Are there areas where they need support?
Employee engagement: Are your employees happy and motivated?
Workforce demographics: Who makes up your workforce? This can help with diversity and inclusion initiatives.
With this data at your fingertips, you can make informed decisions about your HR strategies and improve areas like recruiting, workplace management, and employee performance.
Key Benefits of Using HR Dashboards
Here’s how HR dashboards can help deliver impactful results:
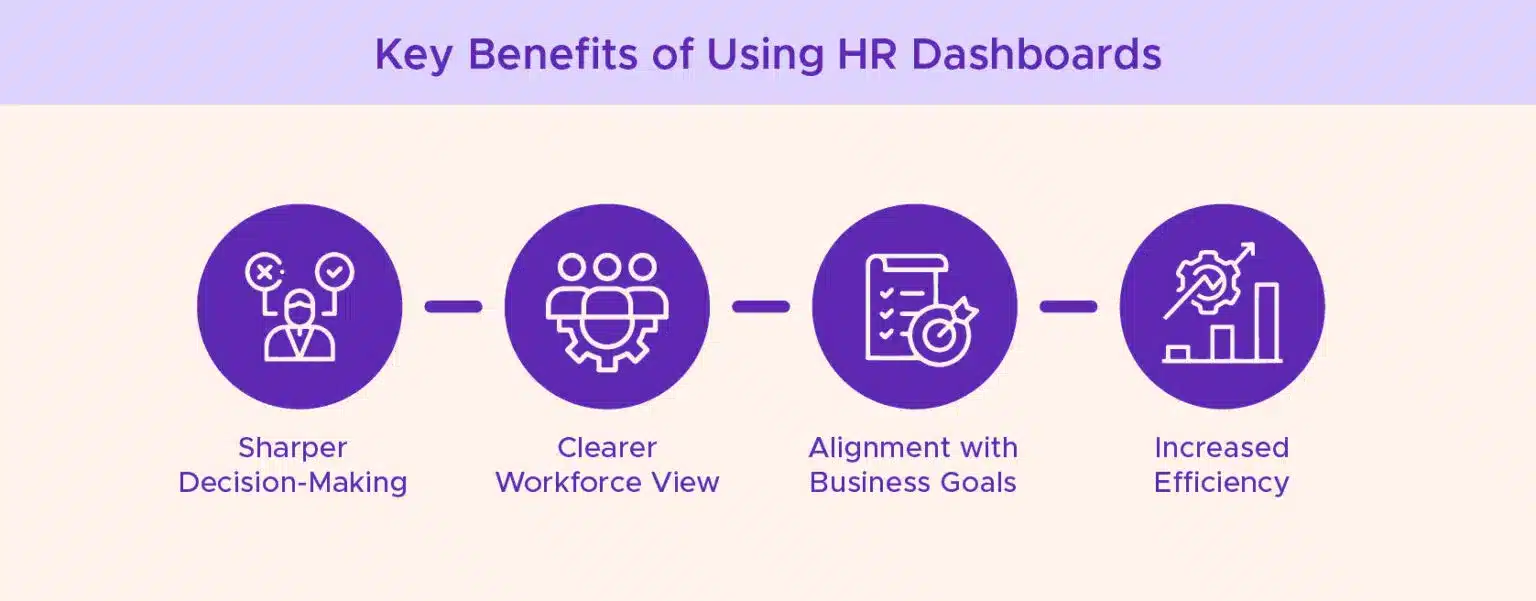
Sharper Decision-Making
With HR dashboards, decision-making becomes sharper and more precise. Real-time data empowers informed choices to tackle critical workforce challenges effectively.
For instance, optimize recruitment strategies by analyzing key metrics for targeted improvements or address high turnover rates by identifying problem areas through dashboard insights.
Clearer Workforce View
HR dashboards provide a holistic view of the entire workforce, enabling the identification of trends and early detection of potential issues. For example, if employee satisfaction scores decline in a specific department, proactive measures can be taken to address concerns and foster a more engaged workforce.
Alignment with Business Goals
These dashboards bridge the gap between HR initiatives and organizational objectives. They demonstrate the direct impact of workforce dynamics on overall performance. By tracking the ROI of training programs, HR can showcase their value and tailor strategies to support broader business goals.
Increased Efficiency
HR dashboards streamline data analysis and reporting processes, saving valuable time previously spent compiling reports manually. This efficiency allows HR teams to focus more on strategic initiatives like enhancing employee engagement, improving talent management, and contributing to the organization’s overall success.
Now that we’ve established the significance of HR dashboards, let us quickly look at the key features of an efficient HR dashboard.
Essential Features of a Best-in-Class HR Dashboard
While there are multiple features to look for in an efficient HR dashboard, we have curated a list of must-haves you shouldn’t miss.
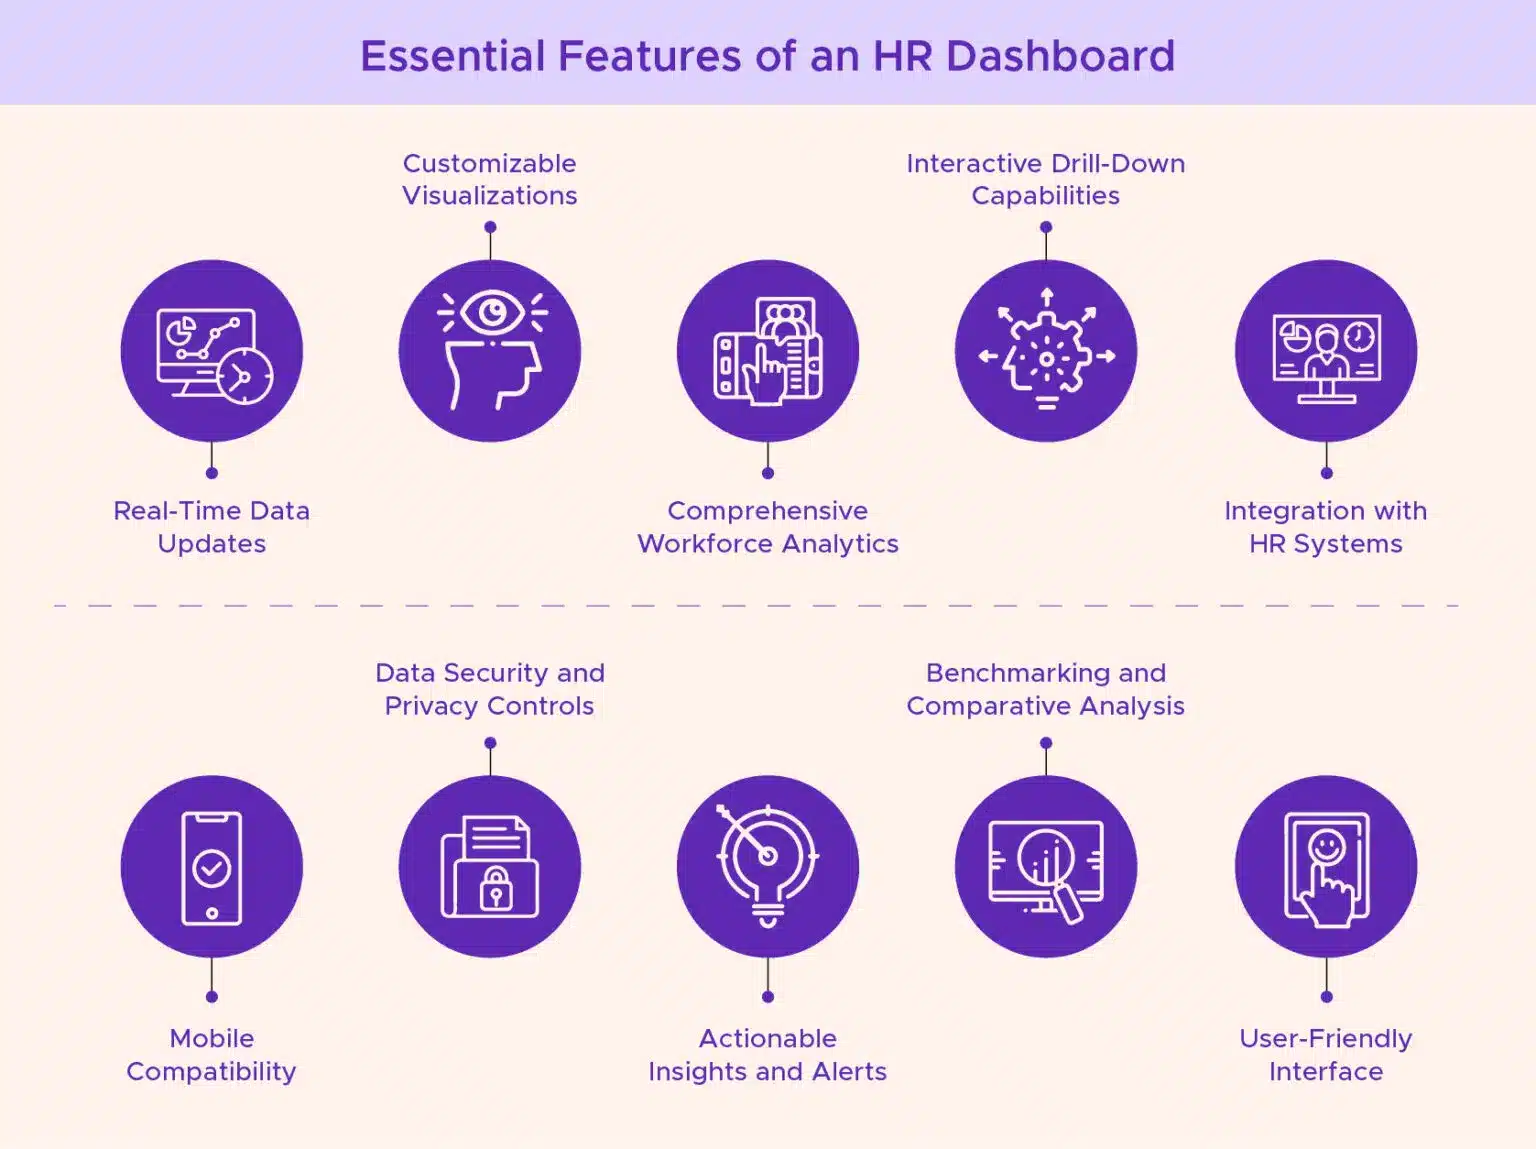
Real-Time Data Updates: A top-notch HR dashboard should provide real-time updates on key metrics like employee turnover rates, recruitment status, and training effectiveness. This ensures that decisions are based on the latest information.
Customizable Visualizations: The ability to customize charts, graphs, and dashboards based on specific needs is crucial. Best-in-class HR dashboards allow users to tailor visualizations to highlight trends, anomalies, and KPIs that matter most to their organization.
Comprehensive Workforce Analytics: An effective HR dashboard offers comprehensive workforce analytics, including demographics, performance trends, and employee engagement metrics. This holistic view helps in understanding workforce dynamics and making informed decisions.
Interactive Drill-Down Capabilities: The dashboard should allow users to drill down into specific data points for deeper insights. Interactive features enable users to identify root causes of issues and explore correlations between different HR metrics.
Integration with HR Systems: Seamless integration with existing HR systems (such as HRIS, ATS, and performance management tools) is essential. This ensures data accuracy and avoids manual data entry, saving time and reducing errors.
Mobile Compatibility: Accessibility on mobile devices is becoming increasingly important. A best-in-class HR dashboard should be responsive and functional on smartphones and tablets, allowing HR professionals to access critical information on the go.
Data Security and Privacy Controls: Given the sensitivity of HR data, strong security measures and privacy controls are imperative. The dashboard should comply with data protection regulations and offer role-based access to ensure confidentiality.
Actionable Insights and Alerts: The dashboard should not only display data but also provide actionable insights and alerts. Automated notifications for critical events (e.g., low performance scores or upcoming training expirations) empower proactive decision-making.
Benchmarking and Comparative Analysis: Including benchmarking capabilities to compare HR metrics against industry standards or previous performance levels adds value. This enables organizations to gauge their competitiveness and identify areas for improvement.
User-Friendly Interface: Last but not least, a best-in-class HR dashboard should have an intuitive and user-friendly interface. Ease of use encourages adoption across the organization and empowers HR professionals to leverage data effectively in their decision-making processes.
HR Dashboard Examples
HR dashboards aren’t one-size-fits-all. They can be customized to meet the specific needs of different stakeholders within your organization. Here’s how:
Recruitment Dashboard
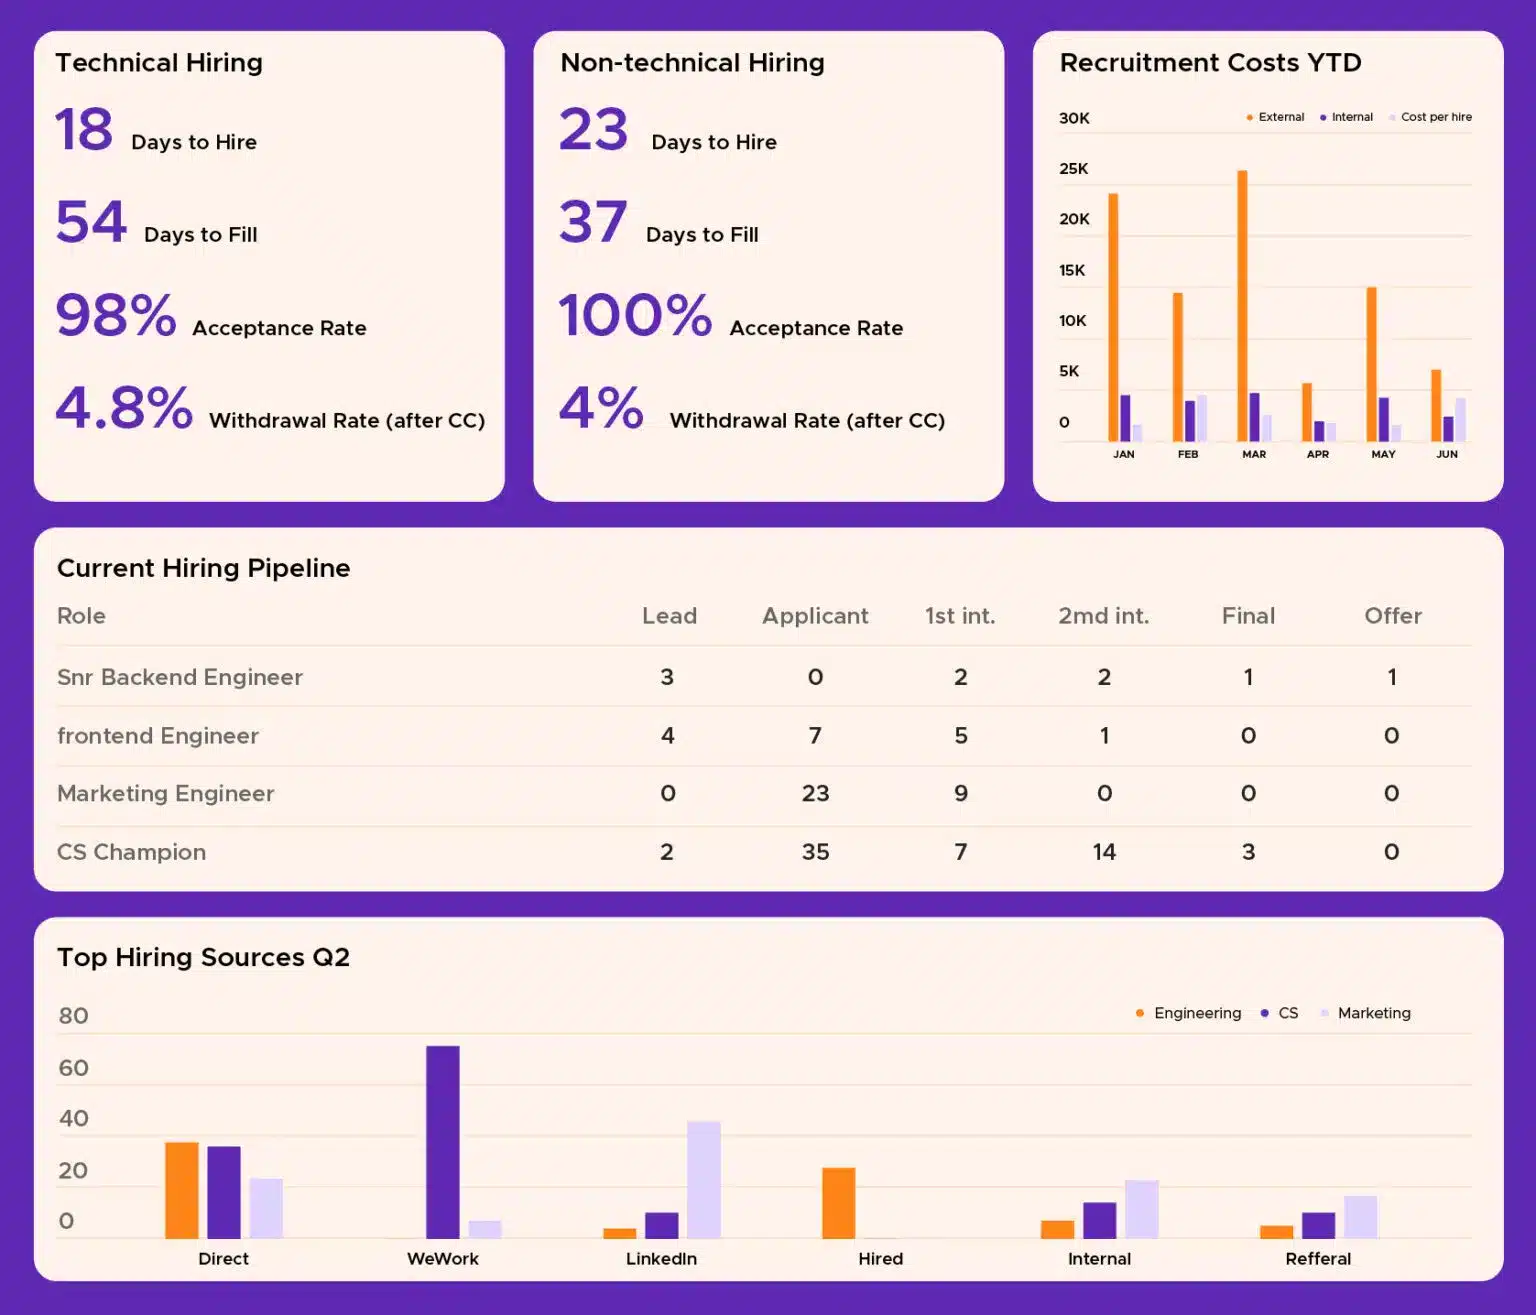
Imagine a single screen providing senior leaders with a clear picture of the organization’s most critical HR metrics. This is the essence of an executive HR dashboard. It might display:
- Headcount Trends: Track overall headcount and its distribution across departments. Identify areas for potential growth or restructuring.
- Time-to-Hire: Monitor the average time it takes to fill open positions. Analyze trends and identify bottlenecks in the recruitment process.
- Employee Turnover Rate: Keep a pulse on employee retention. Investigate departments with high turnover to understand the root causes and develop targeted retention strategies.
- Cost-per-Hire: Track the average cost associated with filling open positions. This data can inform decisions on recruitment strategies and resource allocation.
- Employee Satisfaction Score: Gauge overall employee sentiment. Identify areas where employee satisfaction is low and take proactive steps to address concerns.
With these insights at their fingertips, executives can make informed strategic decisions about talent acquisition, workforce management, and overall business goals.
Employee Performance Dashboard
Employee performance dashboards provide a data-driven view of individual and team performance. This empowers managers and HR professionals to:
- Identify Top Performers: Recognize high-performing employees and tailor development plans to further enhance their skills and contributions.
- Pinpoint Areas for Improvement: Analyze individual and team performance metrics to identify skill gaps and areas needing development. This allows for targeted training and coaching interventions.
- Track Progress Towards Goals: Monitor progress towards individual and team performance goals. This fosters accountability and motivates employees to stay on track.
- Compare Performance Across Teams: Benchmark performance across different departments or teams. Identify best practices and implement them throughout the organization.
For example, a sales performance dashboard might track individual sales figures, conversion rates, and customer satisfaction scores. This data can help identify sales reps exceeding expectations and those needing additional support to reach their targets.
Workforce Demographics Dashboard
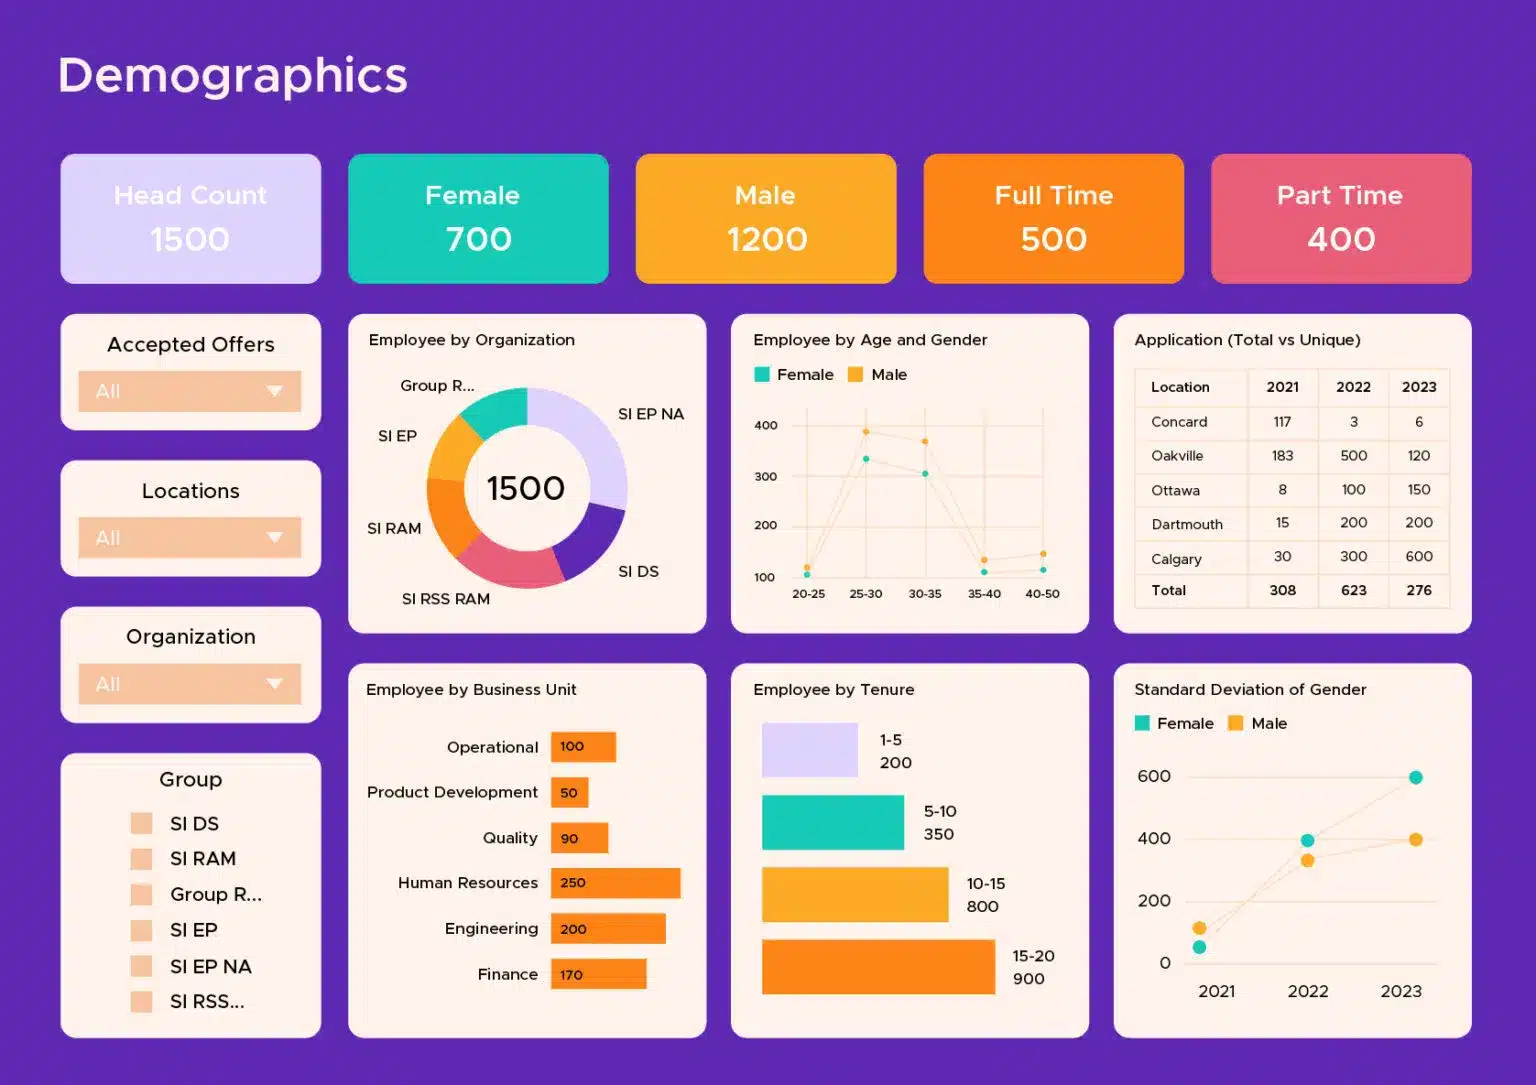
Workforce demographics dashboards provide valuable insights into the composition of your organization’s employee population. This data can be critical for:
- Diversity and Inclusion Initiatives: Analyze the makeup of your workforce by gender, ethnicity, age, and other relevant demographics. Identify areas for improvement to create a more diverse and inclusive workplace.
- Talent Acquisition Strategies: Understanding the demographics of your current workforce can inform your recruitment efforts. Tailor your recruitment channels and outreach strategies to attract talent from diverse backgrounds.
- Retention Strategies: Analyze demographic trends in employee turnover. Identify any demographic groups with higher turnover rates and explore potential causes. This can inform targeted retention strategies for these specific groups.
For example, a demographics dashboard might reveal an underrepresentation of women in leadership positions. This data can be used to develop programs aimed at promoting women’s career advancement within the organization.
Now that we’ve seen some HR dashboard examples, let’s discuss the best practices for creating HR dashboards at your organization.
Best Practices for Creating Effective HR Dashboards
While HR dashboards offer a wealth of potential, their effectiveness hinges on thoughtful design and implementation. Here are some key best practices to guide you:
Define Clear Objectives and Target Audience
Before diving into data, ask yourself: What are you trying to achieve with this dashboard? Who will be using it?
A dashboard for senior leaders will focus on high-level metrics, while one for managers might delve deeper into individual performance data. Clearly defined objectives ensure the dashboard delivers the right information to the right people.
Focus on the Most Relevant Metrics
Don’t get overwhelmed by data overload! Select a manageable set of Key Performance Indicators (KPIs) that directly align with your HR objectives. Prioritize metrics that tell a clear story and offer actionable insights. Remember, quality over quantity is key for a clear and impactful dashboard. Here are some metrics you can track:
| Objective | Relevant Metrics |
| Recruitment Optimization | – Time-to-Fill |
| – Cost-per-Hire | |
| – Quality of Hire (performance ratings of new hires) | |
| – Applicant Source Effectiveness | |
| – Offer Acceptance Rate | |
| Employee Engagement | – Employee Net Promoter Score (eNPS) |
| – Employee Satisfaction Survey Results | |
| – Turnover Rate (voluntary vs. involuntary) | |
| – Engagement Survey Participation Rate | |
| – Recognition and Feedback Metrics (e.g., number of recognitions per employee) | |
| Talent Development & Retention | – Training Hours per Employee |
| – Skills Gap Analysis | |
| – Promotion Rate | |
| – Internal Mobility Rate | |
| – Succession Planning Progress | |
| Performance Management | – Performance Appraisal Completion Rate |
| – Goal Achievement Rate | |
| – 360-Degree Feedback Results | |
| – Performance Improvement Plan (PIP) Effectiveness | |
| Diversity & Inclusion | – Diversity Index (gender, ethnicity, etc.) |
| – Inclusion Survey Scores | |
| – Representation in Leadership Positions | |
| – Pay Equity Analysis | |
| – Employee Resource Group Participation |
Keep it User-Friendly
Your dashboard should be visually appealing and easy to navigate. Utilize clear charts, graphs, and concise data visualizations. Ensure the layout is intuitive, allowing users to find the information they need quickly and efficiently.
Prioritize Data Accuracy and Consistency
Garbage in, garbage out. Ensure your data sources are reliable and consistent. Regularly review and update data to maintain the accuracy and integrity of your insights.
Foster Collaboration and Feedback
Involve stakeholders in the design process. Gather feedback from potential users to ensure the dashboard meets their needs. Encourage ongoing feedback to keep the dashboard relevant and evolve alongside your HR strategies.
Consider Interactivity
Don’t settle for static reports. Interactive dashboards allow users to drill down into data, explore trends, and uncover hidden insights. This empowers them to ask deeper questions and gain a more nuanced understanding of the workforce.
Remember, start simple and scale up! Don’t try to build the perfect dashboard all at once. Begin with a core set of metrics and functionalities. As your HR team and comfort level grow, you can gradually add new features and complexity.
Must-Have Reports Every HR Dashboard Should Have
To create an effective HR dashboard, include these must-have reports to provide comprehensive insights into key aspects of workforce management:
| Report Name | Description and Key Metrics |
| Recruitment Pipeline Report | Track open positions, recruitment stages, time-to-fill, applicant sources, and offer acceptance rates. |
| Employee Turnover Analysis | Analyze turnover trends by department, tenure, and reasons for leaving. Identify retention challenges and trends. |
| Employee Engagement Survey Results | Display engagement scores, feedback, and participation rates from employee surveys. Monitor changes over time. |
| Training and Development Metrics | Highlight training hours per employee, course completion rates, and skills development progress. |
| Performance Management Dashboard | Showcase performance appraisal completion rates, goal achievement metrics, and feedback results. |
| Diversity and Inclusion Dashboard | Track workforce diversity metrics, representation in leadership roles, and inclusion survey scores. |
| HR Budget and Cost Analytics | Provide insights into HR expenditure, including recruitment costs, training budgets, and compensation trends. |
| Compliance and Regulatory Reporting | Monitor compliance with labor laws, equal employment practices, and HR policy adherence. |
| Health and Wellness Metrics | Track absenteeism rates, wellness program participation, and usage of health-related benefits. |
| Strategic HR KPIs | Define and report on strategic KPIs aligned with organizational objectives, such as revenue per employee or HR ROI. |
Leverage HR Dashboards with Peoplebox People Analytics Platform
Peoplebox goes beyond just being an HR dashboard tool. It’s a comprehensive people analytics platform designed to empower HR teams to make a strategic impact on your organization. Here’s how Peoplebox delivers:
- Seamless Data Integration: Peoplebox unifies your HR data, eliminating silos and ensuring a single source of truth.
- Effortless Report Building: Build custom reports with ease, allowing you to tailor insights to specific needs and answer your most pressing HR questions.
- Real-Time Data at Your Fingertips: Peoplebox boasts real-time data updates, keeping your dashboards current and insights fresh.
- Actionable Workforce Analytics: Peoplebox goes beyond data visualization, offering powerful analytics tools to uncover trends, identify opportunities, and make data-driven HR decisions.
- User-Friendly Interface: Peoplebox is designed with ease of use in mind, empowering HR professionals of all technical skill levels to leverage the power of people analytics.
By choosing the right HR dashboard tool, you can transform your HR function from reactive to proactive, ultimately driving a more engaged, productive, and successful workforce.
Explore Peoplebox and see how it can empower your HR team to make a strategic impact on your organization.


